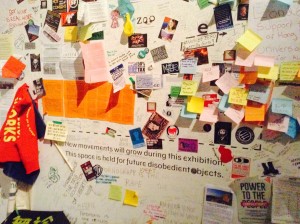
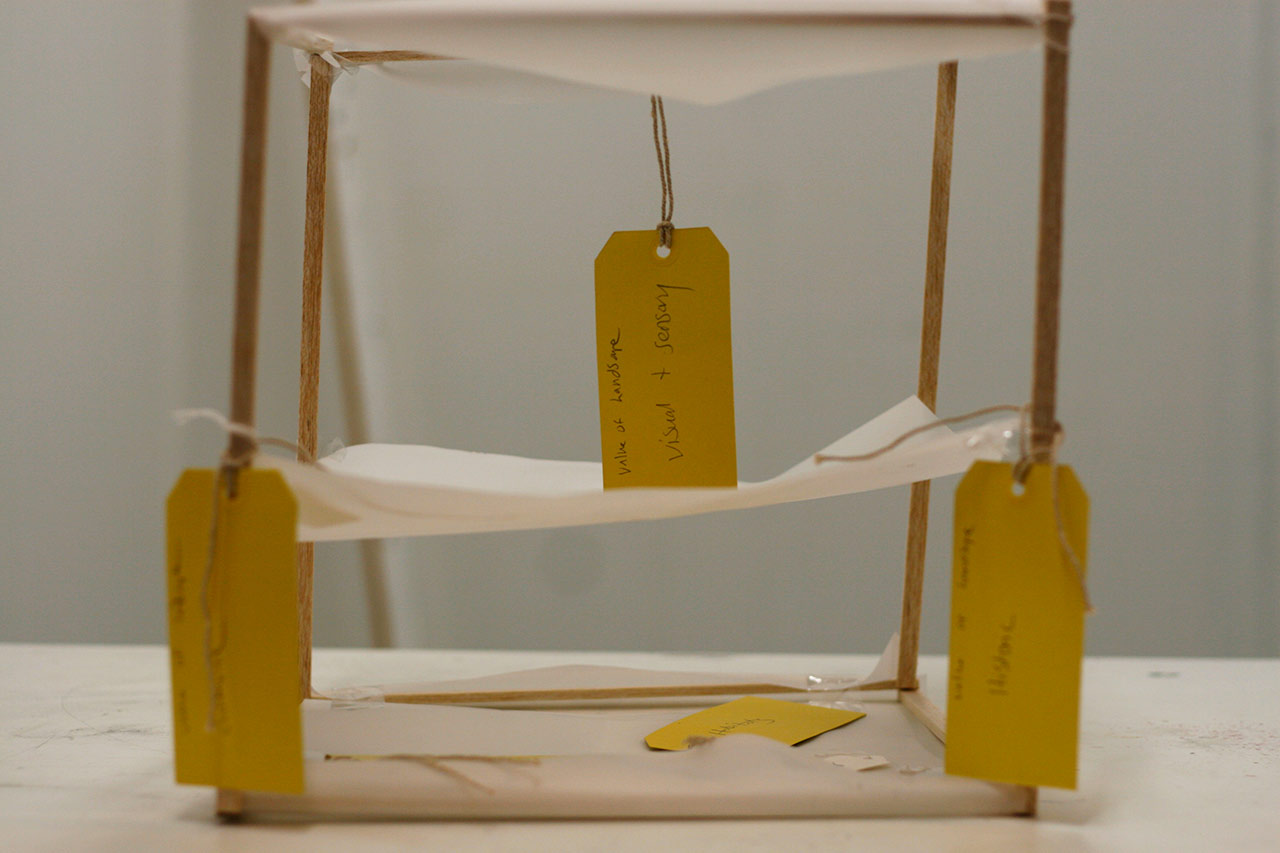
I’m going to make a model about the topic Eco-system Services. I am not sure how yet. I will draw inspiration from the unexpected as well as the expected, and from some of my favourite people like Nam june paik, Pierre Huyghe and one of the best exhibitions this year at the V& A.
‘Disobedient Objects’
So far I am using Tree I.D. quadrants ideas to plot where Landscape Character Assessment data is located in a spatial square. Below I am plotting what makes a landscape using a Welsh framework (more ref. to come soon) and within it I am thinking where does perceptual and eco-system service data sit. This will help me to draw and make maps about it. A few people have said the term seems too mechanical; another way of measuring and dividing up landscape and what wilderness we have. I guess that’s why I am looking at the collection and display of perceptual data; to see if communicating perceptions about such things makes them less mechanical but more importantly, gathers data about how people feel about different types of services in an area.


